In today’s data-saturated world, the ability to transform raw numbers into clear, actionable insights is no longer a luxury – it’s a necessity. Businesses, researchers, and organizations of all sizes rely on data to drive strategic decisions, understand customers, optimize operations, and uncover new opportunities. But navigating the sheer volume and complexity of data requires powerful tools.
This is where Business Intelligence (BI) and data visualizations tools shine. These tools are specifically designed to help you connect to diverse data sources, prepare and analyze information, and create compelling, interactive visualizations and dashboards. Choosing the right platform can dramatically accelerate your time to insights and empower users across your organization.
This post explores five leading business intelligence and visualization tools as of early 2025, highlighting their strengths, key features, and ideal use cases. We have ranked them based on factors like market leadership, list of features, and user adoption to help you make an informed decision. Let’s dive into the tools that are shaping how we analyze and visualize data today (and even tomorrow)!
1. Microsoft Power BI
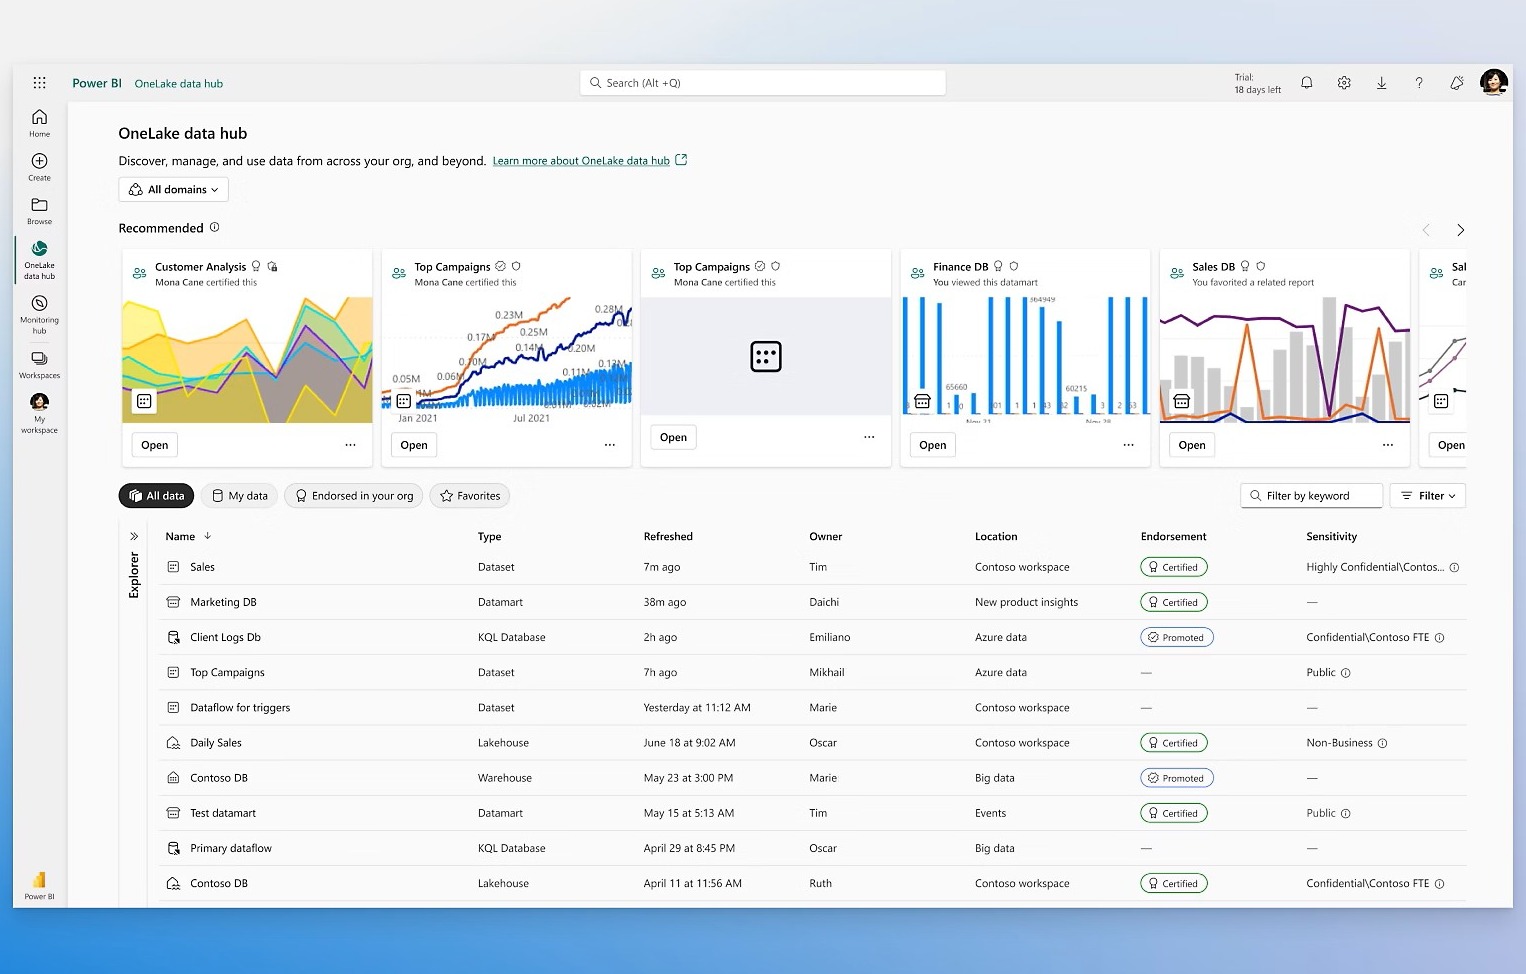
Microsoft Power BI stands out as a comprehensive, integrated platform for data analysis and visualization. As a core part of the Microsoft ecosystem, it offers unparalleled integration with tools like Excel, Azure, and Microsoft 365, making it a natural choice for many organizations. Its affordable plans is the another reason for its high adoption in organizations. Power BI provides a full suite of capabilities: from data connection and preparation to sophisticated analysis and interactive reporting.
Key Features
- Power Query: A robust, user-friendly engine (shared with Excel) for connecting to hundreds of data sources, cleaning, transforming, and modeling data – all inside Power BI.
- DAX (Data Analysis Expressions): A powerful formula language that enables creating complex custom calculations, measures, and sophisticated data models for deeper analysis.
- Interactive Visualizations & Reports: A wide array of built-in charts and graphs, a marketplace for custom visuals, and the ability to build dynamic, drill-down reports and dashboards.
- Power BI Service: A cloud-based service for publishing reports and dashboards, sharing insights, and collaborating with colleagues. Supports scheduled refreshes and row-level security.
- Seamless Microsoft Integration: Effortlessly connects with Excel, SharePoint, Teams, Azure data services (Synapse, Data Lake), Dynamics 365, and more under Microsoft’s umbrella.
- Cost-Effectiveness: Widely regarded as having a competitive pricing model, especially with its free Power BI Desktop application and affordable Pro licenses, making is highly accessible.
- AI Capabilities: Incorporates built-in AI features such as natural language Q&A, automated insights (Quick Insights), key influencers analysis, and anomaly detection.
Power BI is a market-leading, versatile, and powerful BI platform. Its strengths lie in its end-to-end capabilities, deep integration within the Microsoft ecosystem, strong community support, and attractive pricing. While advanced data modeling with DAX requires a learning investment, its overall value, feature richness, and scalability make it an exceptional choice for organizations of all sizes seeking comprehensive business intelligence – especially if they are using Microsoft 365 or Azure.
2. Tableau
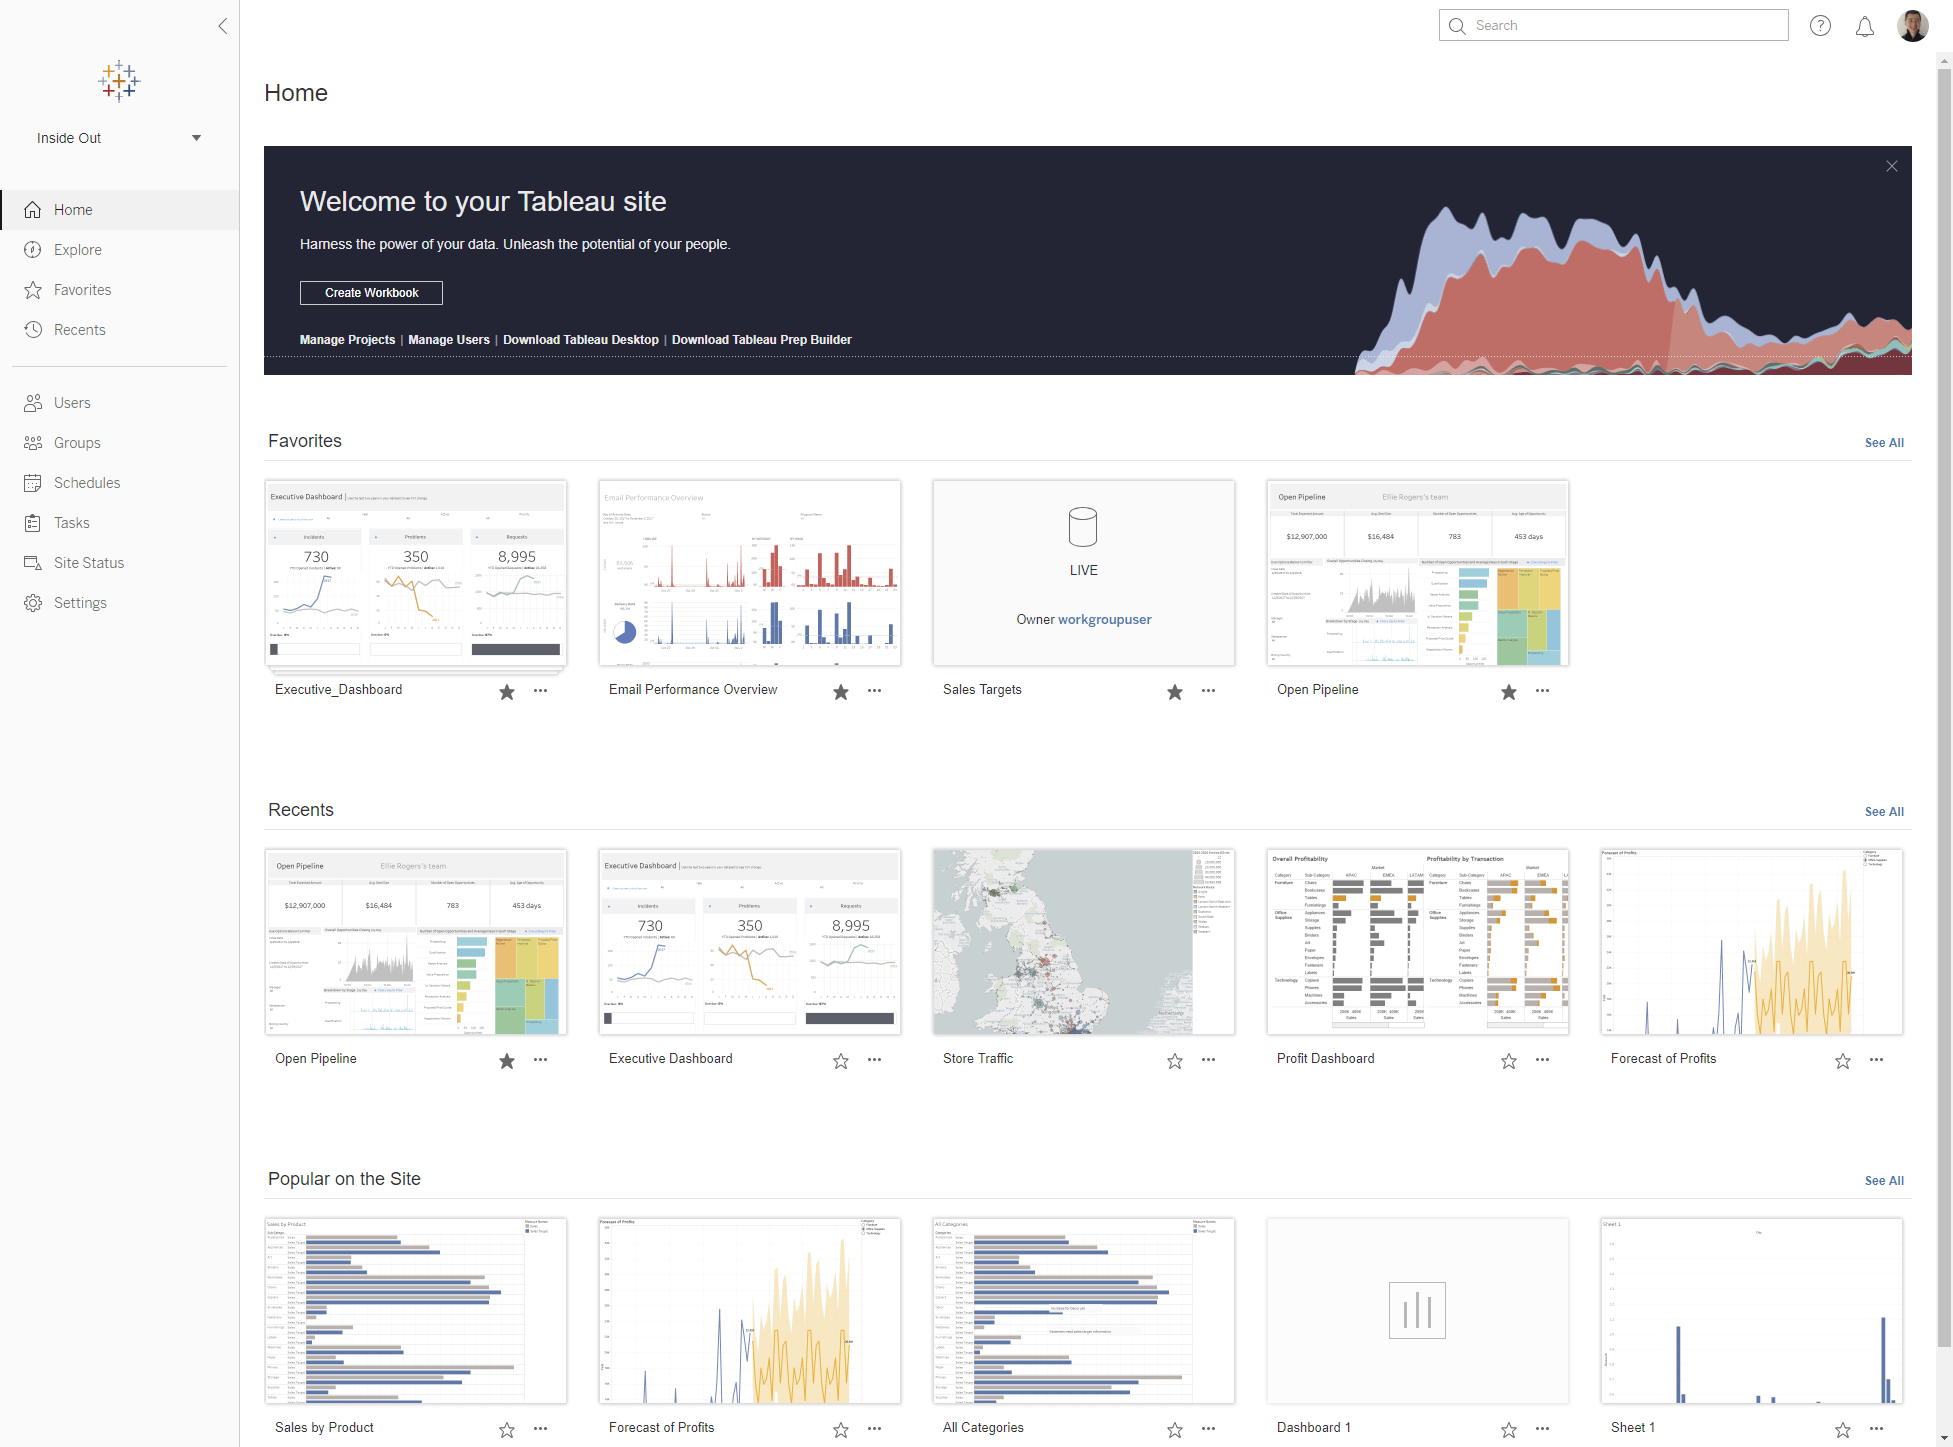
Tableau is another giant in the BI and analytics space, celebrated for its best-in-class data visualization capabilities and intuitive user experience. Acquired by Salesforce, it continues to excel at enabling users to visually explore data, quickly identify trends, and create beautiful, highly interactive dashboards. Tableau’s core philosophy revolves around helping people see and understand data through visual analysis. However, it is also known for its less affordable plans compared to Power BI.
Key Features
- Intuitive Drag-and-Drop Interface: Creates sophisticated visualizations simply by dragging data fields onto the canvas, making powerful visual analysis accessible to a broad audience.
- Stunning Visualizations: Offers a wide array of beautiful and effective chart types, maps, and graphs, with fine-tuned control over aesthetics for compelling data storytelling.
- Interactive Dashboards: Enables the combination of multiple views into interactive dashboards where users can filter, highlight, and drill down to explore data dynamically.
- Broad Data Connectivity: Connects natively to a vast number of data sources: from spreadsheets and databases to SaaS applications and big data platforms.
- Tableau Prep Builder: A visual and direct tool for cleaning, shaping, and combining data before analysis, simplifying data preparation workflows including data cleaning.
- Active Community: One of the largest and most active user communities among data analysis tools, providing ample resources, product support, and shared knowledge.
- Flexible Deployment Options: Offers solutions for individuals (Tableau Desktop), teams (Tableau Cloud - formerly Tableau Online), and large enterprises (Tableau Server).
Tableau remains a leader in visual analytics, prized for its ease of use in creating stunning and interactive visualizations. It empowers users to explore data freely and quickly to uncover insights. While enterprise licensing can be more expensive than some competitors, its focus on high-impact visualization, user experience, and flexibility makes it a top choice, particularly for organizations prioritizing self-service reporting and data storytelling and visual exploration. Its easy integration within the Salesforce ecosystem is another benefit for many large organizations.
3. Looker Studio (Google Data Studio)
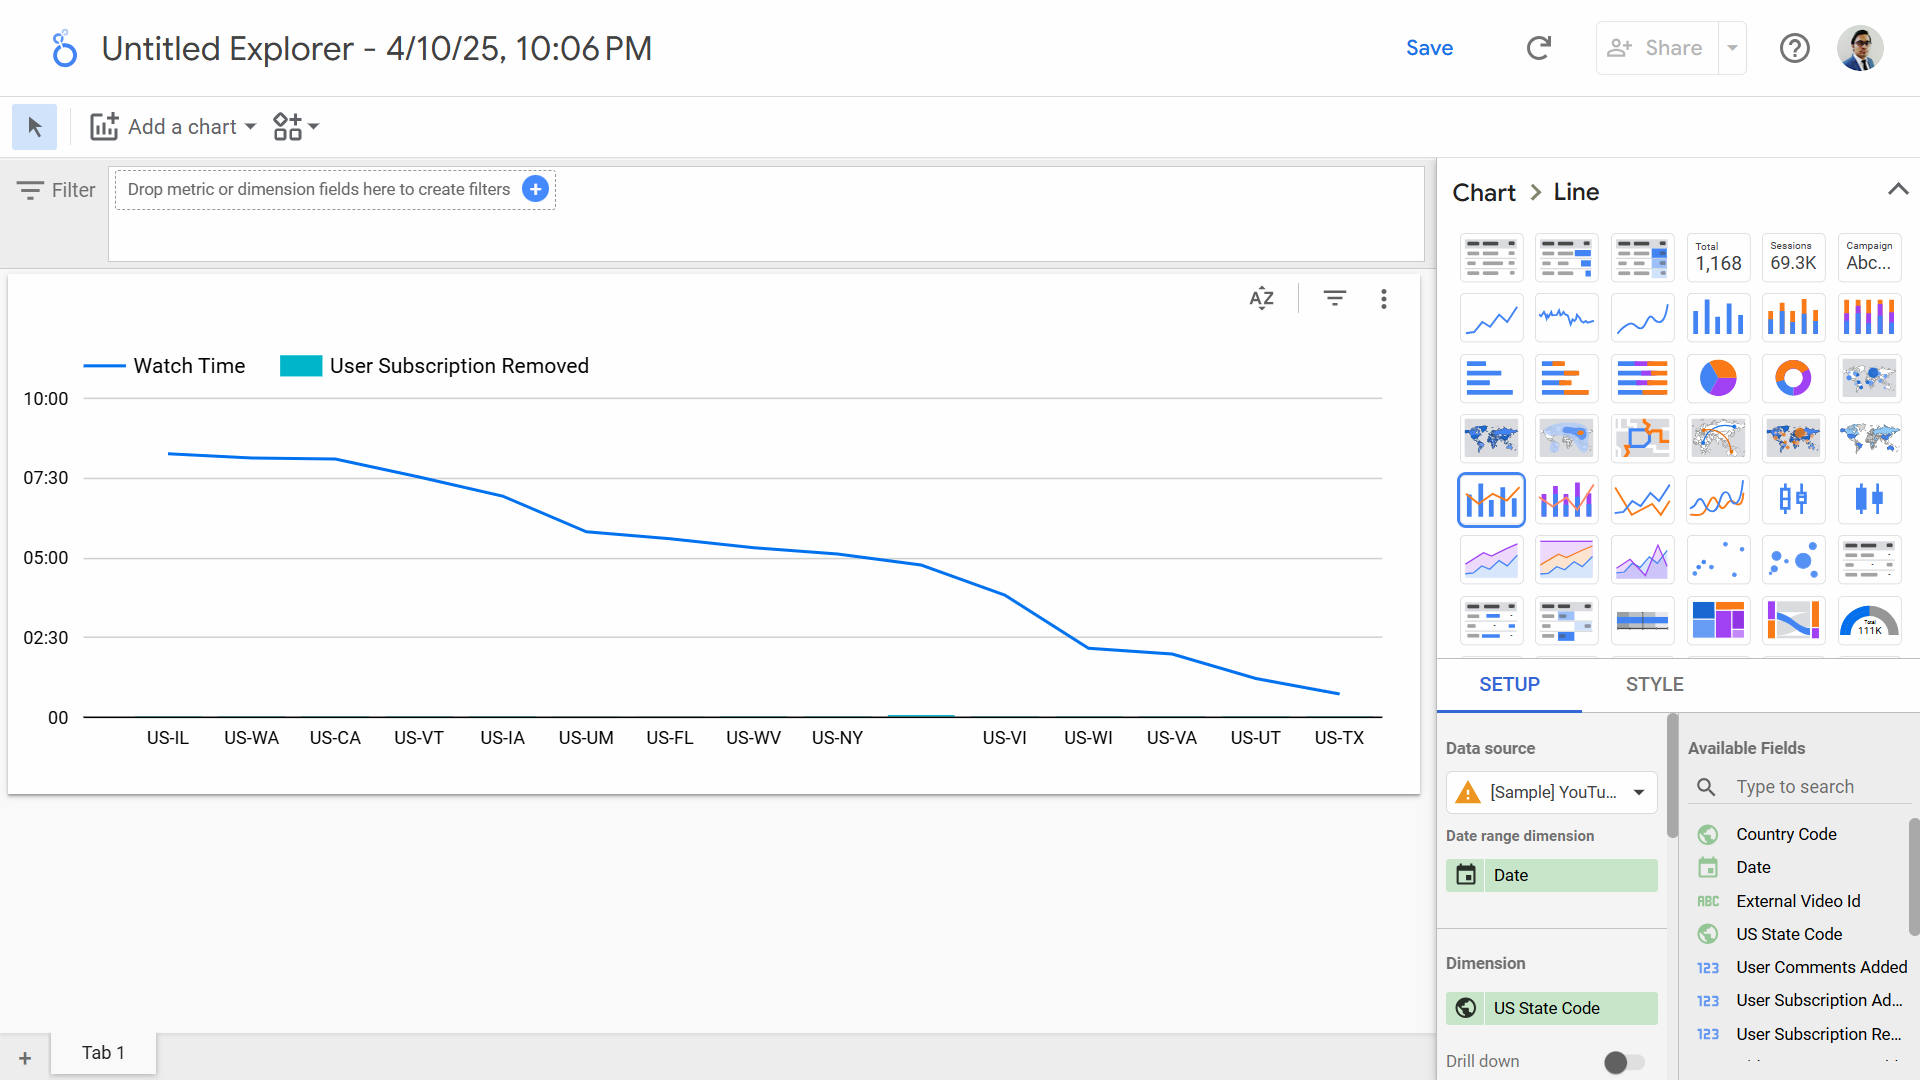
As part of the Google Cloud family, Looker offers a powerful and modern approach to business intelligence and data applications. It’s important to distinguish between the widely used free Looker Studio (formerly Google Data Studio) for dashboarding and visualization, and the enterprise-grade Looker Platform, which is known for its robust data modeling layer (LookML) and data governance features. Looker’s both offerings leverage Google’s infrastructure and integrate seamlessly within the Google Cloud ecosystem including BigQuery, Cloud SQL and Google products.
Key Features
Looker Studio (Free)
- Free and Easy: Easy-to-use web interface for creating interactive dashboards and reports.
- Data Connectors: Excellent native connectivity to Google ecosystem’s data sources (Google Analytics, Google Ads, BigQuery, Google Sheets, Cloud SQL, Cloud Storage, etc.)
- External Datasets: Wide range of connectors for third-party databases and applications including SQL and NoSQL databases, data warehouses like Snowflake and SaaS applications.
- Collaboration Options: Simple sharing and collaboration features.
Looker Platform (Enterprise)
- Built on the top of Looker Studio: Offers everything available in the free platform and more.
- LookML: A unique semantic modeling layer where data analysts can define business logic and metrics centrally. This ensures consistency and governance across all reports and explorations. This relates directly to Power BI’s DAX and Tableau’s Prep Builder features, in comparison.
- Online Platform: Browser-based interface for data exploration and dashboard creation.
- Embedding Options: Focus on creating curated data experiences and embedding reports into other applications, bringing data analysis to external people or wider audience.
- Governance and Security: Strong data governance and data security capabilities.
Looker, in both its offerings, provides a compelling cloud-native analytics solution. Looker Studio is incredibly popular for its ease of use and free access, particularly for visualizing data from Google-based data sources. The enterprise Looker Platform excels for organizations needing strong data governance, data security, and the ability to build reliable, scalable data applications through its powerful data modeling layer (LookML). It’s an excellent choice for companies heavily invested in Google Cloud or seeking a robust, governed approach to data analysis and business intelligence (BI).
4. Qlik Sense
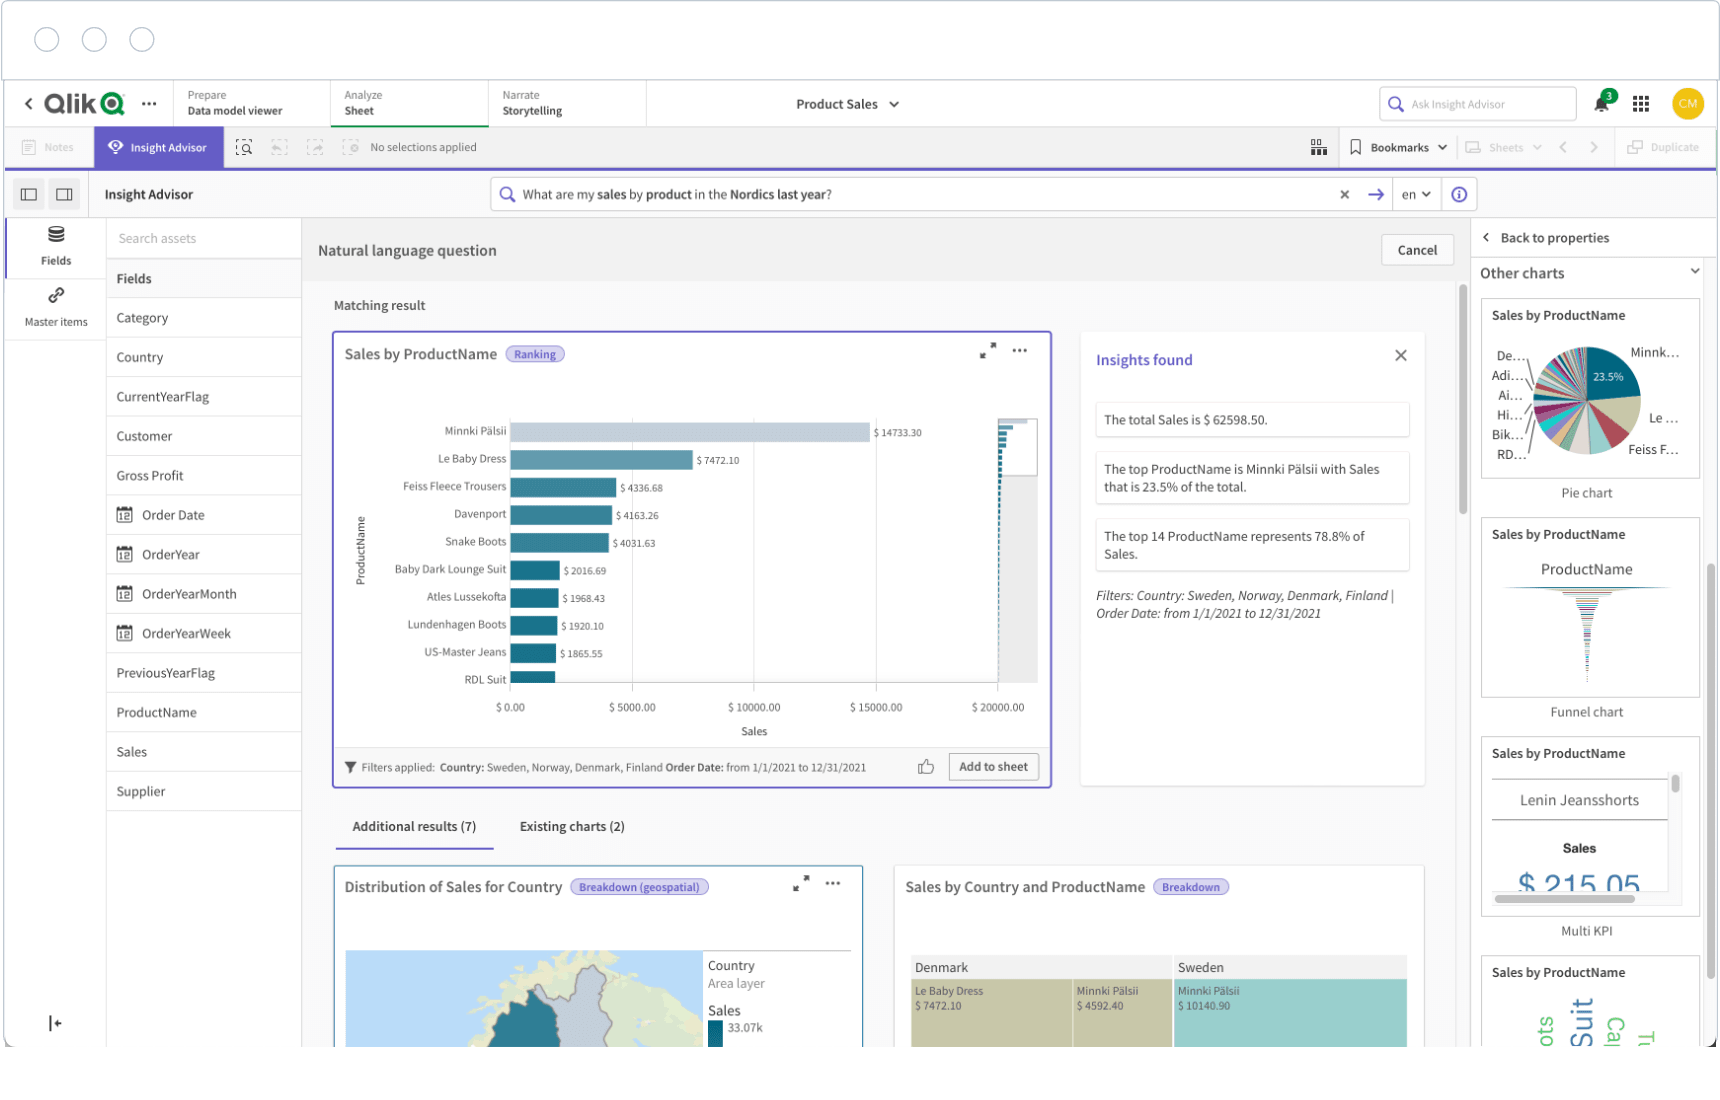
Qlik Sense is a prominent BI platform known for its unique Associative Engine. Unlike query-based tools that often show limited views of data, Qlik Sense’s engine allows users to explore data freely in any direction, uncovering hidden relationships and insights that might be missed otherwise. Qlik Sense is designed for interactive exploration and insights discovery across complex datasets.
Key Features
- Associative Engine: Maps relationships between all data points, allowing users to instantly see associated and unassociated data, enabling more intuitive data exploration.
- Interactive Dashboards and Apps: Users can create dynamic and responsive dashboards and analytics applications to share reports with wider audience or public.
- Augmented Intelligence: GenAI features to suggest relevant analysis, generate visualizations automatically based on natural language queries, and identify hidden patterns.
- Data Preparation: Includes visual data preparation capabilities to load, transform, and combine data from multiple sources – comparable to similar features in alternatives.
- Centralized Governance: Offers features for managing data, security, and applications under one roof for easy and centralized data management across the organization.
- Scalability & Deployment: Available as a cloud-based SaaS solution (Qlik Cloud) or for customer-managed deployments (host on-premises or on private cloud infrastructure).
Qlik Sense offers a powerful and distinct approach to data exploration thanks to its Associative Engine. It empowers users to ask questions freely and uncover unexpected insights within their data. Its combination of associative exploration, AI-driven suggestions, and flexible deployment options makes it a strong contender, especially for organizations dealing with complex datasets where hidden relationships are key to discovery. With the growing usage of GenAI and LLMs, it is definite that alternative tools will offer similar features in near future to empower general users.
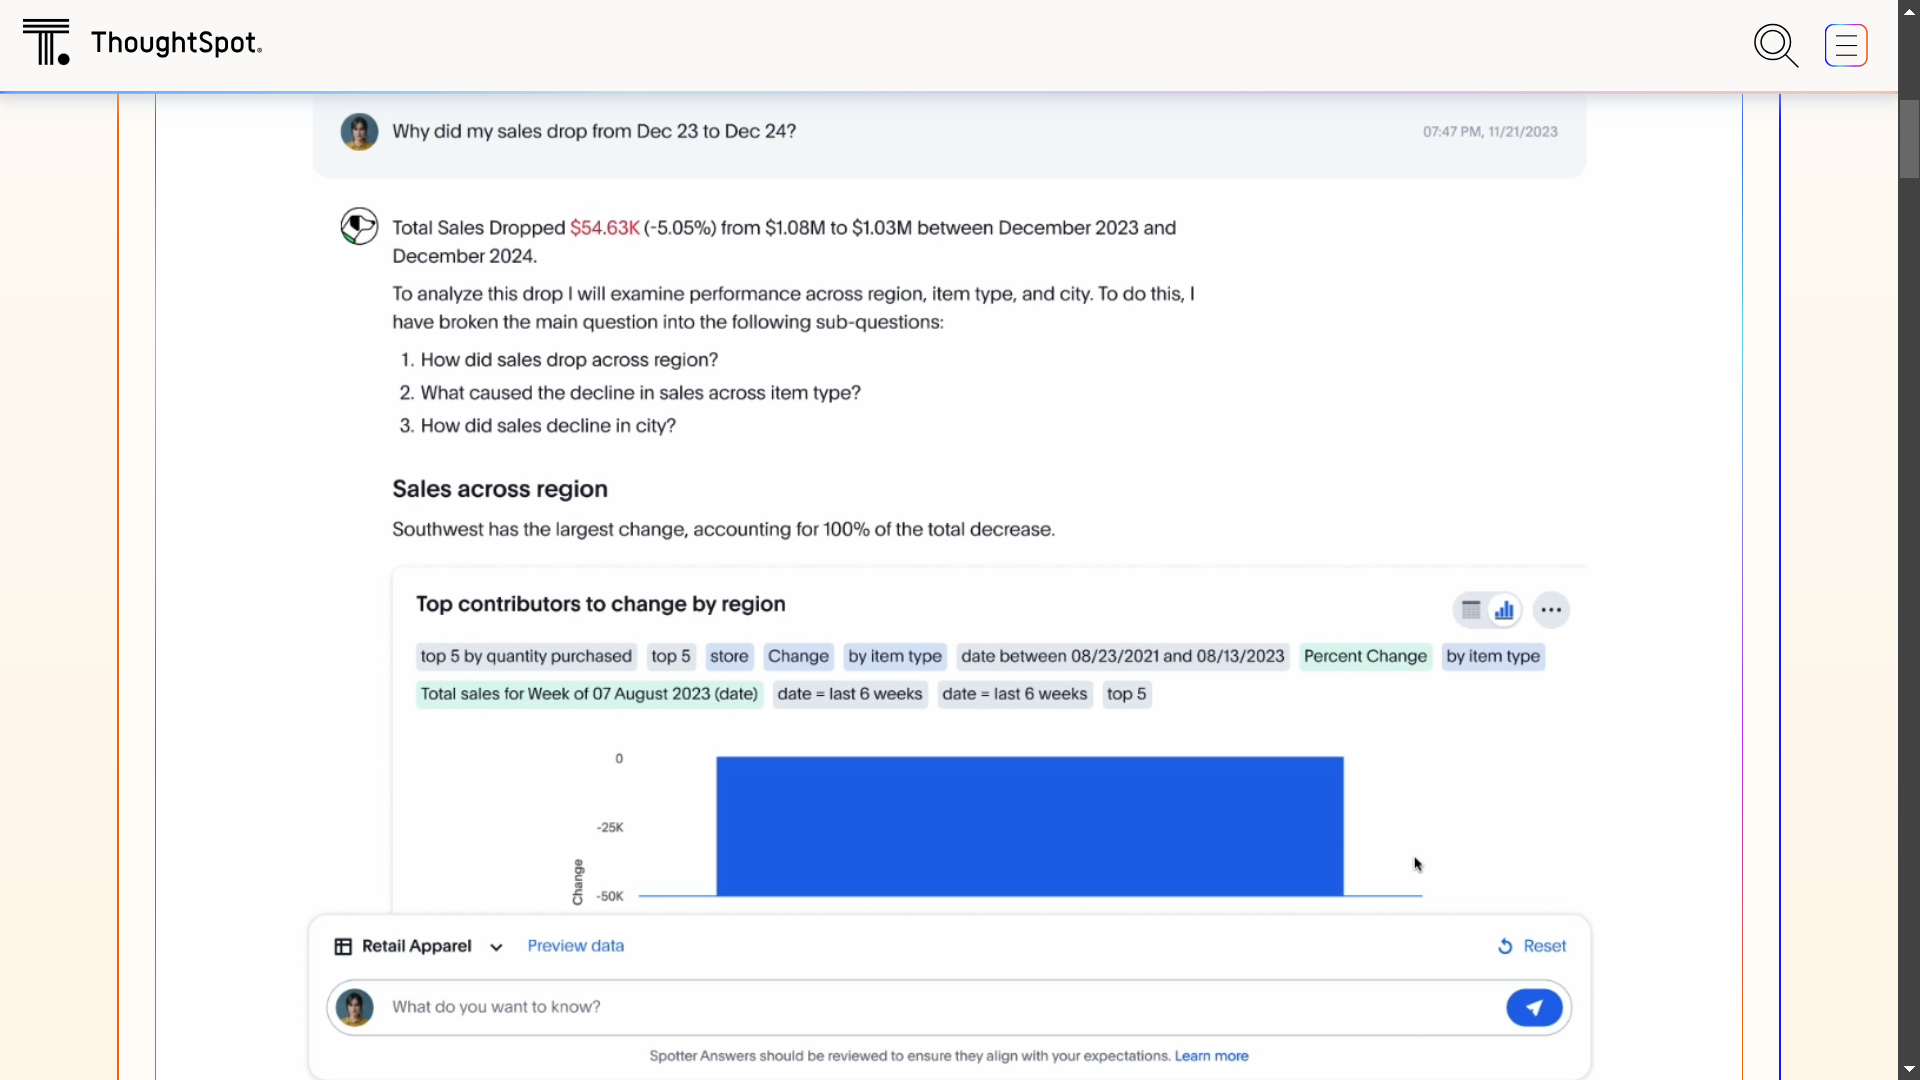
5. ThoughtSpot
ThoughtSpot represents the cutting edge of search-driven and AI-powered analytics. Its platform is designed to make data exploration as simple as using a search engine. As Qlik Sense, it allows users to ask questions about their data in natural language, thanks to GenAI. ThoughtSpot aims to democratize data access and dramatically accelerate the speed at which anyone in an organization can find insights, without requiring deep technical expertise. GenAI features is a growing trend in data analytics and warehousing solutions, e.g., Databricks and Snowflake both allows analysis through chats.
Key Features
- Search-Driven Analytics: Type questions (e.g., “monthly sales by region for product X”) into a search bar and get instant answers in the form of interactive charts and visualizations.
- SpotIQ: An AI engine that automatically analyzes data to uncover hidden trends, anomalies, and correlations that users might not have thought to look for, delivering automated insights.
- Liveboards: More interactive and dynamic dashboards compared to traditional dashboards as they update in real-time and allow deep drill-downs and filters driven by text search.
- Data Connectivity: Connects to a wide range of cloud data warehouses (Snowflake, BigQuery, Redshift and Synapse) and other data sources including SQL and NoSQL databases.
- Embeddability: Offers capabilities (ThoughtSpot Everywhere) to embed search and AI-driven analytics directly into business applications to share reports with wider audience.
- Ease of Use for Business Users: Specifically designed to empower non-technical users to self-serve their own data needs without relying on analysts for every query and report.
ThoughtSpot excels at delivering fast, easy, and accessible data insights through a familiar search interface. Its focus on natural language querying and AI-driven automation makes it a powerful tool for organizations looking to empower business users with true self-service analytics. While it often complements existing BI platforms rather than completely replacing them, its innovative approach to interacting with data positions it as a leader in the self-service data analytics space.
Select the Ideal Analytics Platform
The Business Intelligence and data visualization market offers a wealth of powerful tools, each with unique strengths. As we have seen, the best platform hinges on your specific circumstances:
- Microsoft Power BI for broad features, Microsoft integration, and excellent cost value ratio.
- Tableau for beautiful and interactive data visualizations and rich-looking dashboards.
- Looker Studio for ease of use, Google integration, and robust data modeling.
- Qlik Sense for its unique feature: free-form exploration of complex data relationships.
- ThoughtSpot for its search-based, AI-driven self-service data analytics features.
In short, several factors like primary data sources, project budget, data governance requirements, users’ technical skills, and desired style of analysis (exploration vs. reporting vs. text-based search) should guide your decision. Many organizations even utilize multiple tools for different purposes.
Ultimately, any of these leading analytics platforms can significantly enhance your organization’s ability to transform data into valuable knowledge. We encourage you to investigate further, utilize free trials where available, and embark on this rewarding journey of research-based decision-making.
Which BI tool did you find is the best for your organization? Share your thoughts below.
References
- Microsoft Power BI [ Product Overview (original) (archived) ]
- Tableau [ Overview (original) (archived) ]
- Looker Studio (Google Data Studio) [ Overview (original) (archived) ]
- Qlik Sense [ Key features (original) (archived) ]
- ThoughtSpot [ Agentic Analytics Platform (original) (archived) ]
↫ Previous post